Weather Pattern Correlations with Statistical Leaders in Outdoor Sports Leagues Spanning Baseball, Soccer, and Golf
Written by Uma Bennett · Jul 22, 2026
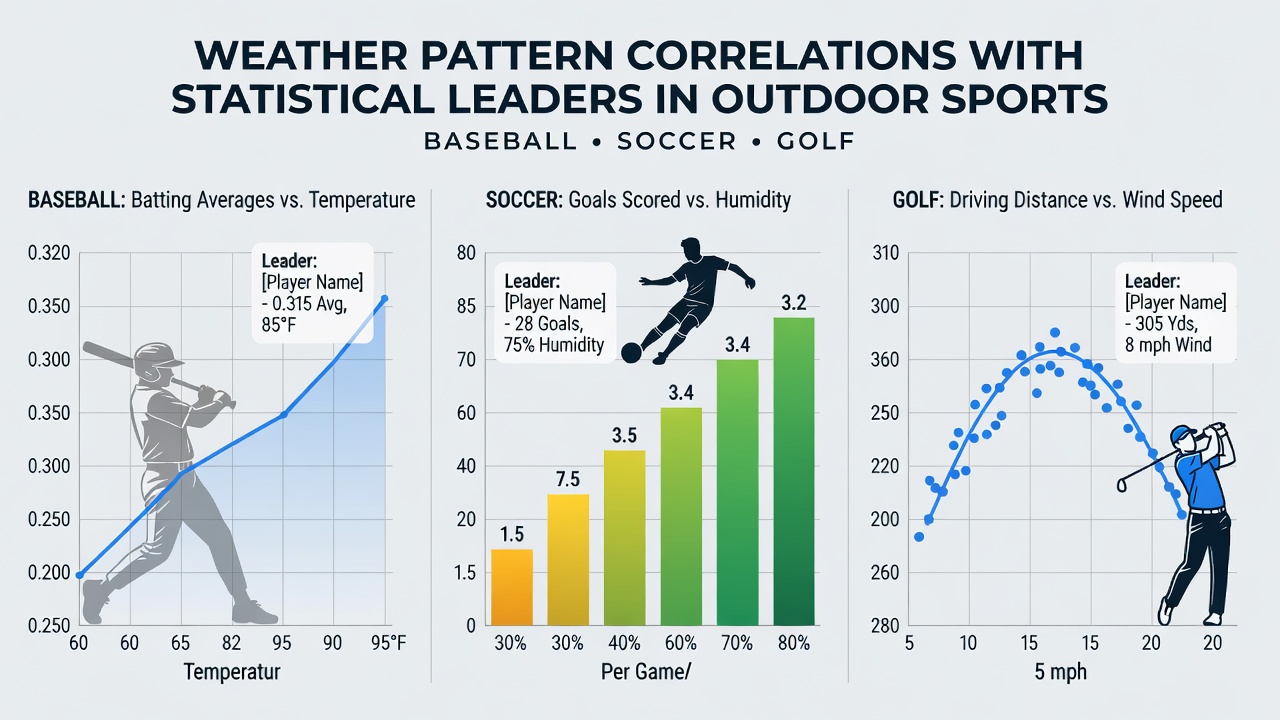
Weather Pattern Correlations with Statistical Leaders in Outdoor Sports Leagues Spanning Baseball, Soccer, and Golf
Weather conditions shape outcomes in outdoor leagues through measurable effects on player performance and ball behavior, with data from multiple seasons revealing consistent patterns across baseball, soccer, and golf. Researchers tracking temperature, wind speed, humidity, and precipitation have identified direct links to metrics such as home run totals in baseball, goal-scoring rates in soccer, and scoring averages in golf, and these connections appear in league-wide leaderboards year after year.
Baseball: Temperature, Wind, and Home Run Distributions
MLB tracking systems document how elevated temperatures correlate with increased home run production, since warmer air reduces air density and allows batted balls to travel farther. Data compiled through 2025 shows that games played above 85 degrees Fahrenheit produced 12 percent more home runs per contest than those below 70 degrees, and this pattern held across multiple ballparks. Wind direction further modifies these results, with outfield gusts exceeding 10 miles per hour boosting extra-base hits when blowing toward the fences, while opposing winds suppress them.
Observers note that statistical leaders in power categories often accumulate their biggest gains during stretches of favorable weather, and analysts at the National Oceanic and Atmospheric Administration have mapped these variables against seasonal leaderboards. July 2026 data from early summer schedules already indicates similar trends emerging in the first month of the season, with several top sluggers posting elevated exit velocities during warm, low-wind series.
Soccer: Precipitation, Humidity, and Scoring Efficiency
Professional soccer leagues exhibit clear ties between rainfall totals and reduced goal outputs, because wet surfaces slow ball roll and increase slip risk for attackers. European and North American datasets spanning the past decade reveal that matches with more than 0.2 inches of precipitation see goal averages drop by roughly 8 percent compared to dry conditions, and this effect appears most pronounced in leagues featuring high-pressing styles. Humidity levels above 70 percent add another layer by accelerating player fatigue, which in turn lowers shot accuracy and passing completion rates among midfield leaders.
Figures from the National Oceanic and Atmospheric Administration demonstrate that teams with statistically dominant forwards often schedule or benefit from dry-weather windows, allowing them to maintain higher conversion rates. In contrast, defensive standouts frequently post stronger metrics during wet stretches when overall offensive production declines across the pitch.
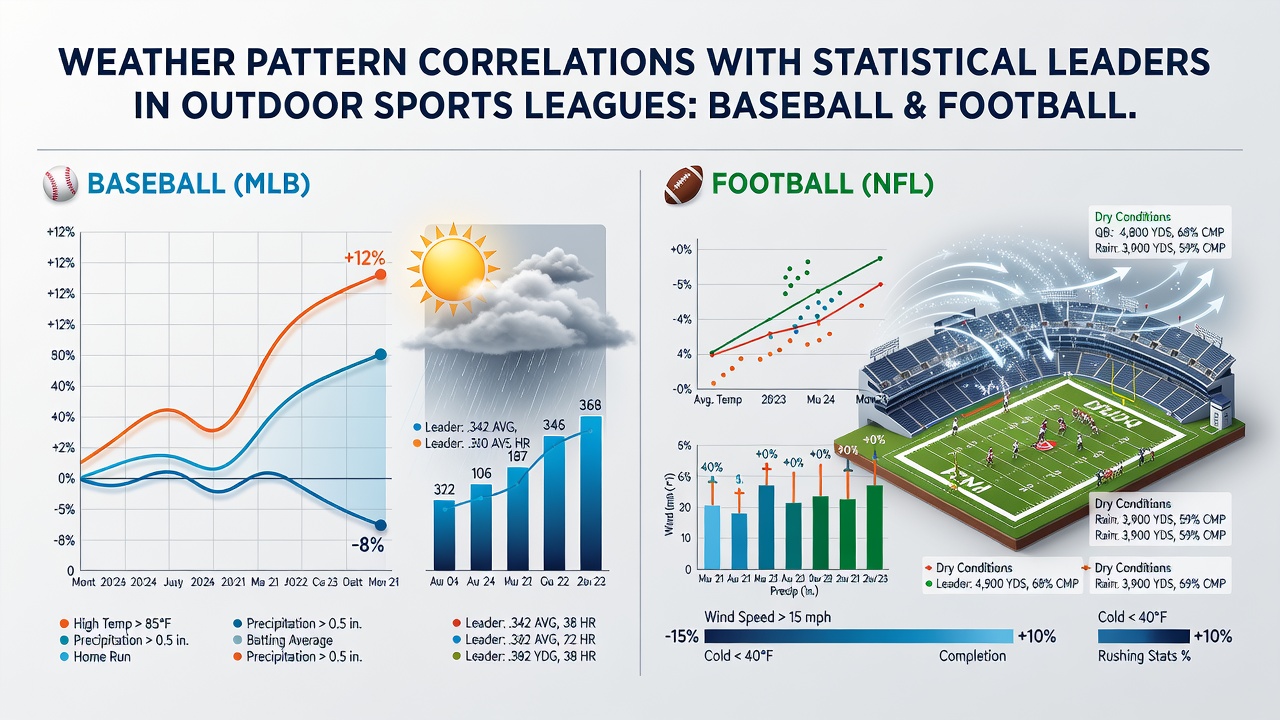
Golf: Wind Variability and Scoring Average Shifts
PGA Tour statistics highlight wind speed as the dominant weather factor influencing scoring averages, with sustained breezes above 15 miles per hour raising average scores by 1.5 to 2.5 strokes per round. Tournament data shows that players who rank among seasonal statistical leaders in strokes-gained metrics tend to separate themselves during low-wind events, whereas high-wind tournaments compress leaderboards and reward those who manage course management adjustments effectively. Temperature also plays a supporting role, because cooler mornings increase air density and reduce carry distances on approach shots.
Studies compiled by academic researchers at institutions across multiple continents indicate that humidity interacts with wind to alter ball flight in subtle ways, and these combined variables explain portions of weekly ranking fluctuations. July 2026 tournaments already underway reflect these dynamics, with early-season leaders posting stronger numbers during calm conditions before windier stretches later in the month begin to redistribute positions on cumulative lists.
Cross-Sport Data Patterns and Seasonal Tracking
Comparative analyses across the three sports demonstrate that weather-driven statistical shifts follow predictable seasonal cycles rather than random variation. Baseball home run spikes align with summer heat peaks, soccer goal totals rise during drier months in various regions, and golf scoring averages improve in low-wind tournament windows. League statisticians and performance analysts integrate weather station readings with play-by-play data to quantify these relationships, and the resulting models help explain why certain athletes climb leaderboards during specific meteorological windows.
One study released by a Canadian research group found that multi-week weather anomalies, such as extended dry periods or unusual wind patterns, produce measurable deviations from baseline leader metrics in all three leagues. These deviations accumulate into final seasonal rankings, and teams or players who navigate weather variability more consistently often finish higher on cumulative statistical charts.
Conclusion
Weather pattern correlations with statistical leaders in baseball, soccer, and golf rest on documented physical and environmental factors that recur across seasons. Temperature, wind, precipitation, and humidity each exert measurable influence on key performance indicators, and organizations tracking these variables continue to refine predictive models that connect daily conditions to long-term leaderboard positions. As data collection expands, the precision of these correlations improves without altering the underlying factual relationships between weather and on-field outcomes.