18 Jul 2026
Stadium Quirks Quietly Tilting Record Books: How Field Dimensions, Crowd Proximity, and Weather Pockets Recalibrate Scoring Hierarchies from Gridiron Tallies to Court Averages and Diamond Outputs
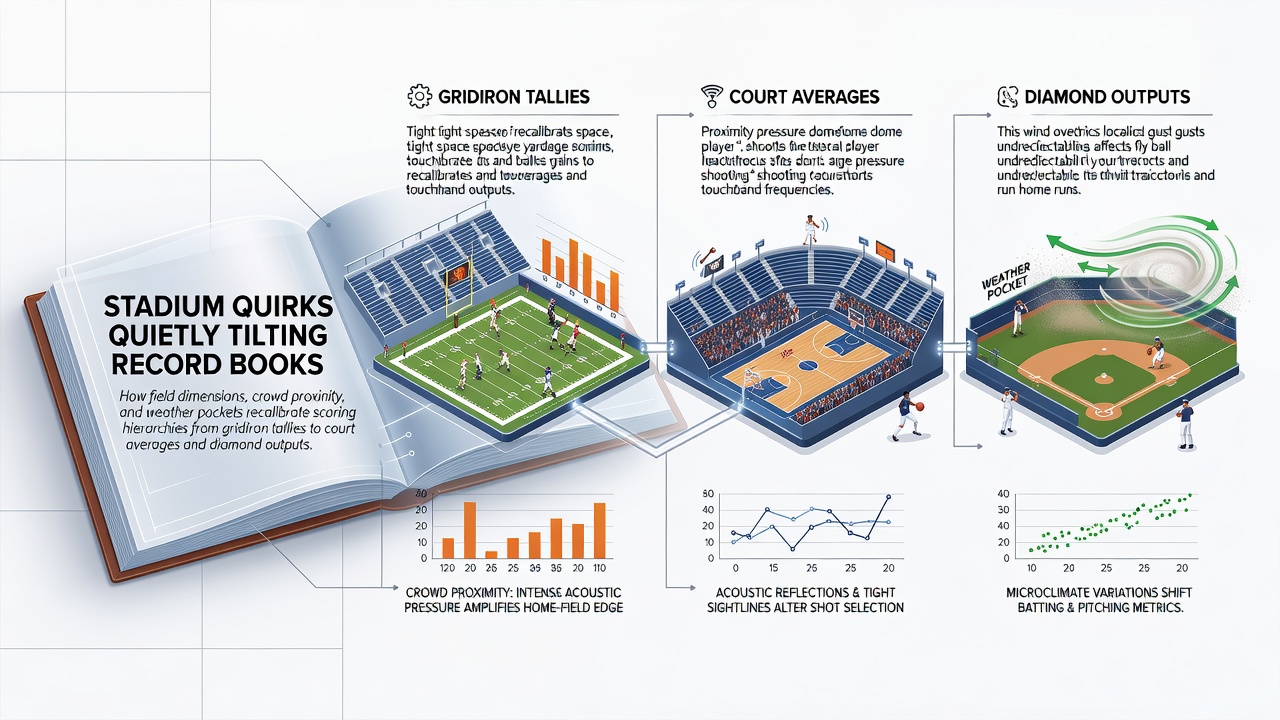
Stadium features shape scoring patterns across professional sports in ways that accumulate over decades yet receive limited attention compared to rule changes or player talent. Field dimensions create persistent advantages for certain offensive or defensive styles while crowd proximity alters player decision-making under sustained noise levels and weather pockets introduce variability that favors teams adapted to local conditions. Data from major leagues shows these elements redistribute statistical leaders without altering official rules.
Field Dimensions and Their Direct Impact on Gridiron and Diamond Outputs
Football fields maintain standard lengths yet vary in end zone configurations and sideline distances from seating structures which influence passing lanes and running angles. Teams playing in venues with tighter sidelines record higher sack rates according to league tracking systems because quarterbacks have reduced escape space. Baseball parks demonstrate even clearer effects through outfield wall distances and foul territory sizes where shorter right field lines boost home run totals for left-handed hitters while expansive center fields suppress extra-base hits.
Studies from the Society for American Baseball Research document how parks like those with deep power alleys reduce slugging percentages by measurable margins compared to standard dimensions. Observers note that players who spend careers in hitter-friendly venues accumulate higher career totals than peers with equivalent skills in pitcher-friendly settings. These patterns hold across multiple seasons because dimensions remain fixed even as rosters turn over.
Crowd Proximity Effects on Court Averages and Performance Under Pressure
Basketball arenas place spectators closer to the playing surface than most outdoor venues which generates continuous auditory feedback that affects free throw accuracy and defensive communication. Venues with lower ceilings and steeper seating banks produce louder reverberations that correlate with elevated turnover rates during road games. League analytics departments track these variables and find home teams in compact facilities maintain higher assist-to-turnover ratios than those in larger open designs.
Research compiled by Canadian sport science institutes indicates sustained crowd density influences heart rate variability among players during critical moments which in turn affects shot selection. Teams accustomed to these environments develop compensatory strategies while visiting squads experience temporary drops in three-point percentages. The cumulative result appears in seasonal leaderboards where players from certain arenas post inflated or deflated averages relative to their true skill levels when measured across neutral sites.
Weather Pockets and Regional Climate Influences on Outdoor Scoring
Open-air stadiums create microclimates where wind patterns and humidity pockets alter ball flight trajectories in football and baseball. Coastal venues experience consistent sea breezes that push fly balls toward foul territory while inland facilities with surrounding topography trap heat and reduce air density which extends batted ball distances. Meteorological data integrated with play-by-play records reveals pitchers in high-humidity locations post lower strikeout rates because breaking pitches lose sharpness.
July 2026 measurements from stadium sensors across multiple cities confirmed ongoing variations in effective air density that continue to shift home run distributions. Gridiron kickers face similar recalibrations when crosswinds develop in stadiums with open end zones and these conditions compound over home stands to create statistical edges for certain specialists. Teams build rosters aware of these patterns yet individual player rankings still reflect the venue-specific outcomes.
Recalibration of Scoring Hierarchies Across Leagues
Statistical hierarchies emerge from the interaction of these factors rather than isolated player ability. A running back who gains yards efficiently in a wide-field stadium may see reduced production when traded to a venue with narrow sidelines while a power hitter benefits from relocation to a shorter porch. League-wide data sets maintained by official statisticians show these venue adjustments account for measurable portions of year-to-year ranking shifts.
Players who split time across multiple stadiums provide natural controls for analysis and their output differences align with documented dimension and climate effects. International comparisons from European football associations further illustrate how pitch widths and crowd distances modify expected goal tallies in ways parallel to American sports patterns. The result is a record book that embeds venue signatures alongside individual achievements.
Long-Term Patterns and Data Integration
Decades of accumulated statistics reveal stable venue effects that persist through coaching changes and equipment updates. Analysts incorporate these variables into advanced models to isolate true talent from environmental contributions yet public leaderboards continue to reflect raw totals. Organizations that track player movement between stadium types document consistent performance deltas that match the physical characteristics of each facility.
Weather monitoring partnerships with national meteorological services supply granular data that leagues now integrate into official records which allows for more precise attribution of scoring events. These integrations highlight how seemingly minor quirks accumulate into substantial differences over full seasons and careers.
Conclusion
Stadium characteristics including field dimensions, crowd proximity, and localized weather conditions systematically influence scoring outcomes across gridiron, court, and diamond sports. The resulting statistical distributions reflect these environmental factors in addition to player skill and team strategy. Ongoing data collection through 2026 continues to quantify these effects while preserving the fixed nature of venue layouts that drive the observed hierarchies.