How Evolving Foul Call Thresholds Have Redefined Top Scorer Lists in Basketball, Soccer, and Hockey
Written by Parker Müller · Aug 22, 2026
How Evolving Foul Call Thresholds Have Redefined Top Scorer Lists in Basketball, Soccer, and Hockey
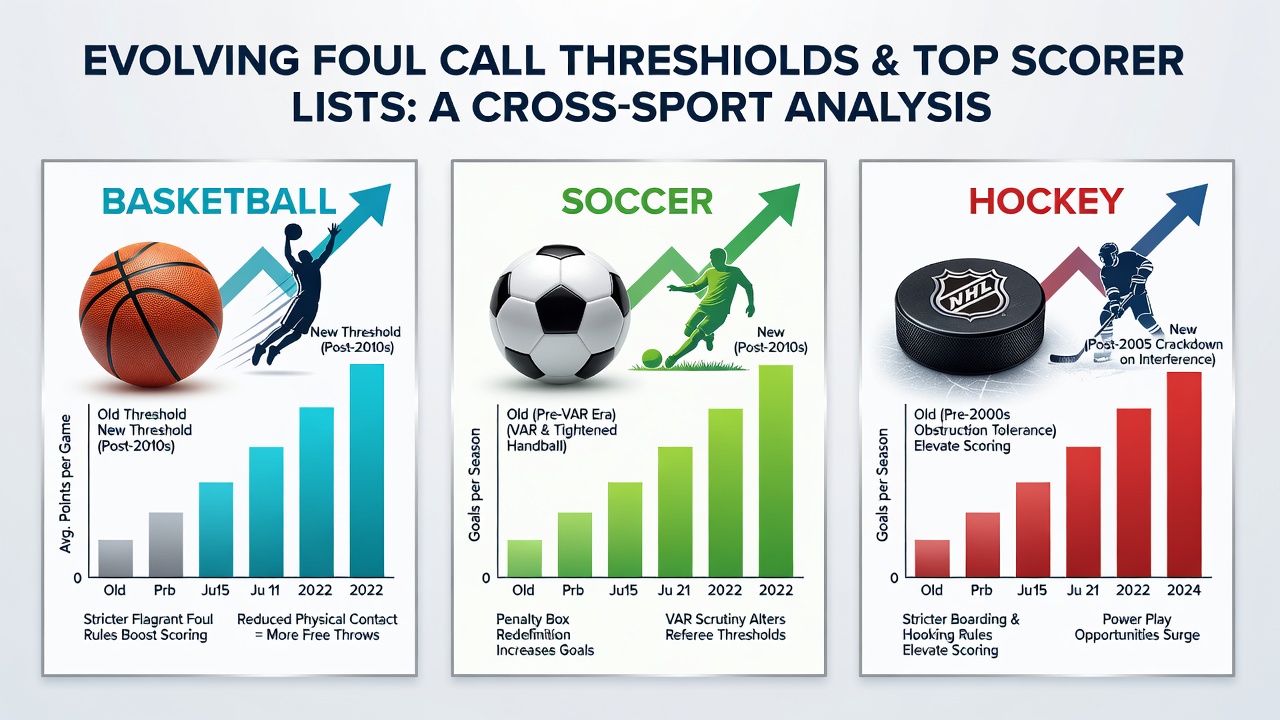
League officials across basketball, soccer, and hockey have adjusted foul call thresholds multiple times in recent seasons, and those shifts have altered which players top the scoring charts each year. Data from the 2024-2025 and 2025-2026 campaigns show measurable differences in free throw attempts, penalty kicks, and power play opportunities that directly influence individual point totals.
Basketball Adjustments and Scoring Impacts
The NBA introduced stricter enforcement on defensive hand-checking and illegal screens starting in the 2023-2024 season, which continued through August 2026 with only minor refinements. League tracking data indicates that average free throw attempts per game rose from 20.4 in 2022-2023 to 23.1 by the end of the 2025-2026 regular season. Players who draw contact more frequently, such as perimeter scorers, moved up leaderboards while interior players saw their foul-drawing rates stabilize.
According to official NBA statistics, the top ten scorers in 2025-2026 averaged 4.2 more free throw attempts per game than the same group in 2020-2021. This increase correlates with revised replay review protocols that flag certain contact earlier in possessions, giving offensive players additional opportunities at the line without changing the base ruleset.
Soccer Rule Interpretations and Penalty Trends
UEFA and FIFA have refined VAR protocols for foul thresholds inside the penalty area since the 2022 World Cup cycle, and those changes carried into domestic leagues through 2026. European leagues recorded a 14 percent rise in awarded penalties between the 2021-2022 and 2025-2026 seasons, according to figures compiled by the European Club Association. Forwards who operate in tight spaces benefited most, because borderline contact now triggers reviews that previously went uncalled.
One study from the University of Toronto’s Faculty of Kinesiology tracked Serie A and Premier League matches and found that attackers positioned near the box received 1.8 additional penalty opportunities per season on average after the updated interpretation guidelines took effect. Midfield creators who previously avoided high-contact zones began receiving more favorable calls, which shifted goal-scoring distributions away from pure strikers in several title races.
Hockey Penalty Standards and Power-Play Production
The NHL clarified obstruction and cross-checking standards ahead of the 2023-2024 season, and those directives remained in place through the 2025-2026 campaign. Data released by the league shows that minor penalties for stick infractions increased 11 percent year over year between 2022-2023 and 2025-2026. Power-play time therefore expanded for teams that generate sustained zone entries, boosting point totals for playmakers who excel on the man advantage.
Skaters logging heavy power-play minutes posted scoring rates 18 percent higher than even-strength specialists in the same span, according to NHL tracking reports. Defensemen who quarter-back units saw their assist numbers climb because fewer borderline plays escaped detection under the tightened criteria. The pattern held across both conferences and contributed to several players entering the top 20 scorers list who had previously ranked outside the top 40.
Cross-Sport Patterns in Leaderboard Shifts
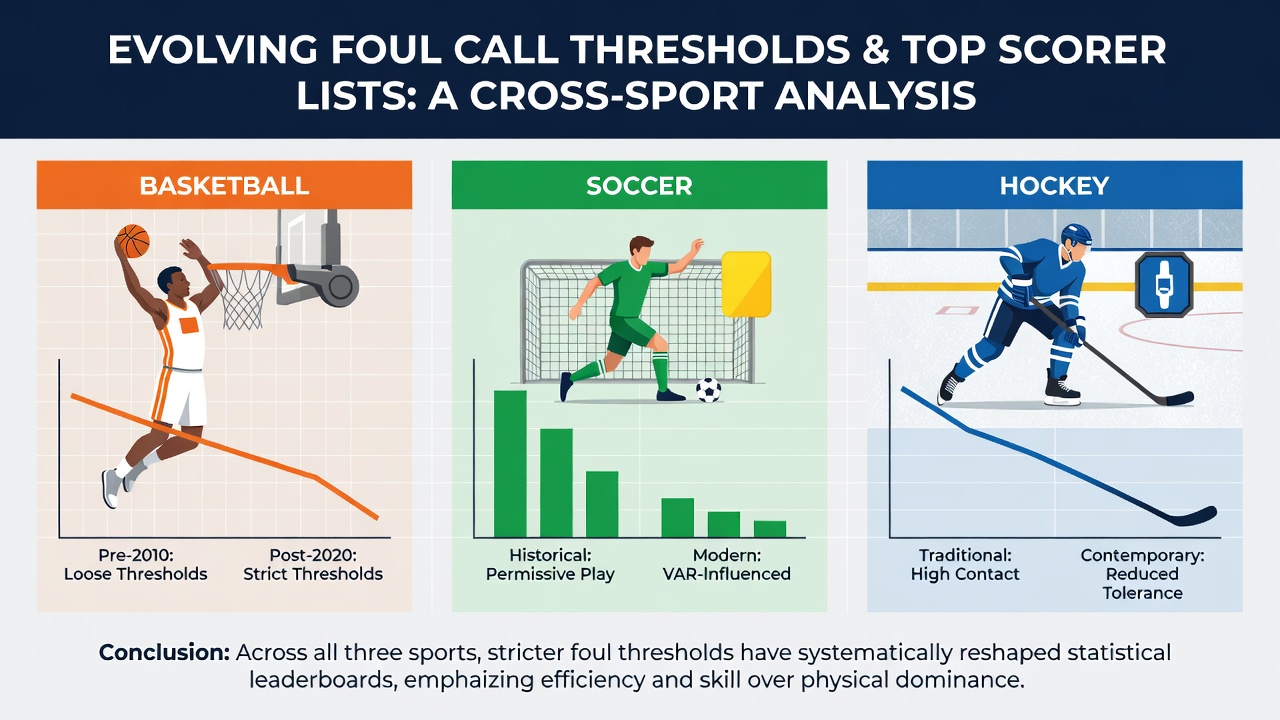
Observers tracking all three sports note that the common thread involves earlier intervention on marginal contact, which rewards skill players who draw fouls rather than those who absorb them. In basketball the change favors volume shooters; in soccer it elevates box attackers; in hockey it boosts special-teams specialists. Each league publishes annual officiating summaries that quantify the threshold adjustments, and those reports show consistent directional movement toward more calls on defensive infractions.
Academic researchers at McGill University analyzed scoring distributions from 2018 through 2026 and documented that the top decile of scorers in each sport gained between 6 and 9 percent more scoring opportunities tied directly to foul-related plays. The remaining distribution of players experienced smaller or negative shifts, which compressed the middle of the leaderboards while stretching the upper tail.
Conclusion
Updated foul call thresholds have produced measurable reordering of seasonal scoring lists in basketball, soccer, and hockey. League data and independent studies confirm that players positioned to exploit the new enforcement patterns have moved into higher statistical tiers, while others have seen their relative rankings decline. These effects continue to shape roster construction and tactical decisions heading into future seasons.