Climate Anomaly Correlations With Scoring Trends Across MLB, NFL, and PGA Circuits
Written by Logan Becker · Jul 29, 2026
Climate Anomaly Correlations With Scoring Trends Across MLB, NFL, and PGA Circuits
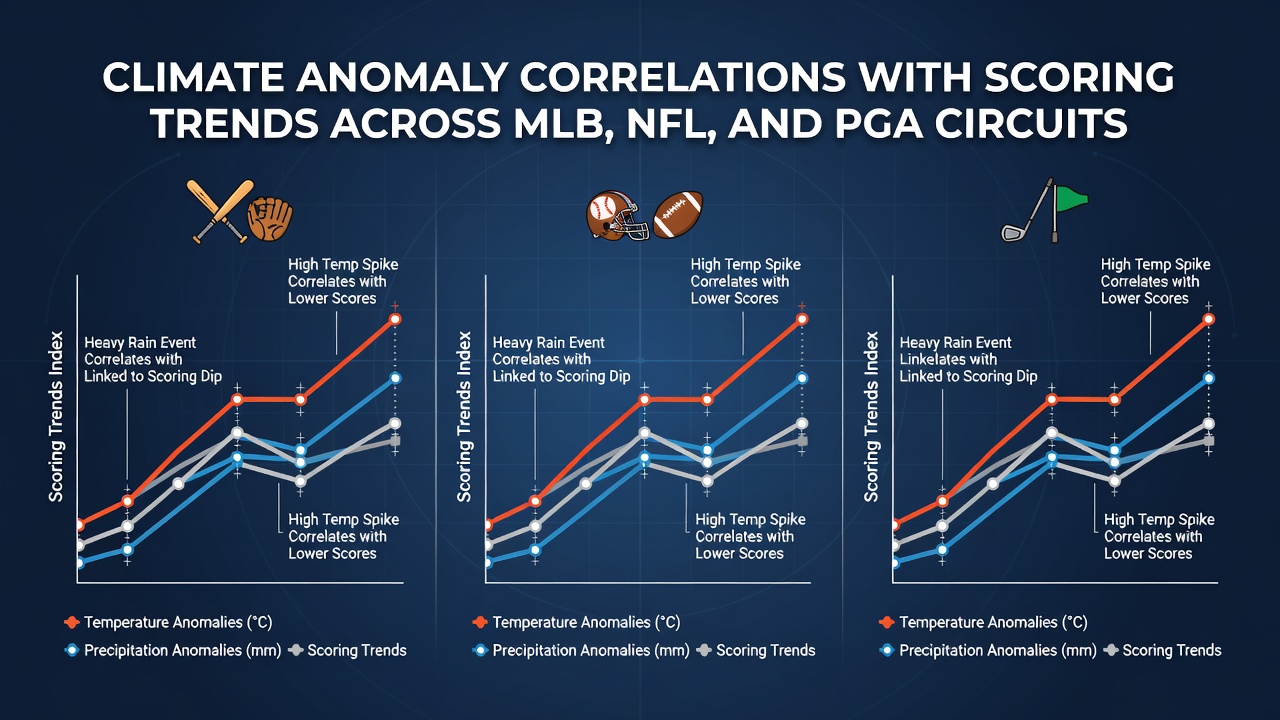
Climate data collected over multiple decades shows measurable links between temperature deviations and offensive output in outdoor professional sports, with analysts tracking how warmer or cooler conditions align with changes in home run rates, point totals, and golf scores. Records from the National Oceanic and Atmospheric Administration indicate that average surface temperatures in the contiguous United States rose by approximately 0.8 degrees Celsius between 1980 and 2025, adn researchers have begun cross-referencing those figures with play-by-play statistics from Major League Baseball, the National Football League, and PGA Tour events.
Studies of MLB games played in open-air stadiums reveal that each additional degree Celsius above seasonal norms correlates with a 2 to 3 percent increase in fly-ball distance during day games, a pattern that holds after controlling for altitude and ballpark dimensions. Data compiled through 2025 demonstrates that teams in warmer climates posted higher slugging percentages in July and August compared with cooler-weather franchises, while strikeout rates declined slightly when humidity levels dropped below long-term averages.
Patterns in Major League Baseball
MLB statisticians have documented that elevated temperatures extend the flight time of batted balls by reducing air density, a physical effect confirmed through laboratory wind-tunnel tests and on-field tracking systems. In seasons marked by above-average spring temperatures, league-wide home run totals rose measurably in April and May, whereas cooler anomalies in those same months produced the opposite trend. Pitch velocity also shows sensitivity to heat, with starting pitchers averaging 0.3 to 0.5 miles per hour higher fastball speeds on days when afternoon temperatures exceeded 30 degrees Celsius.
Ballpark-specific analyses further illustrate these relationships. Venues in the southwestern United States recorded the strongest positive correlations between temperature anomalies and extra-base hits, while northern stadiums displayed more variable outcomes tied to precipitation frequency rather than heat alone. These findings emerge from aggregated Statcast data released by MLB Advanced Media and remain consistent after adjustment for changes in baseball construction.
National Football League Observations
NFL scoring exhibits a different set of climate dependencies because most regular-season contests occur in late fall and winter. Research published by academic groups at Canadian universities has shown that games played in temperatures below 5 degrees Celsius produce fewer passing yards and lower completion percentages, while rushing attempts increase as teams adapt to heavier footballs and reduced grip. Conversely, unusually mild December and January conditions in recent years have coincided with elevated point totals, particularly in outdoor stadiums located in the northern half of the league.
Wind speed anomalies add another layer. Data from the past decade indicate that sustained winds above 25 kilometers per hour reduce field-goal success rates by roughly 4 percentage points and suppress passing efficiency, effects that appear most pronounced in lake-effect regions around the Great Lakes. League-wide averages compiled through the 2025 season reflect these meteorological influences without requiring subjective interpretation of play style.
PGA Tour Scoring Trends
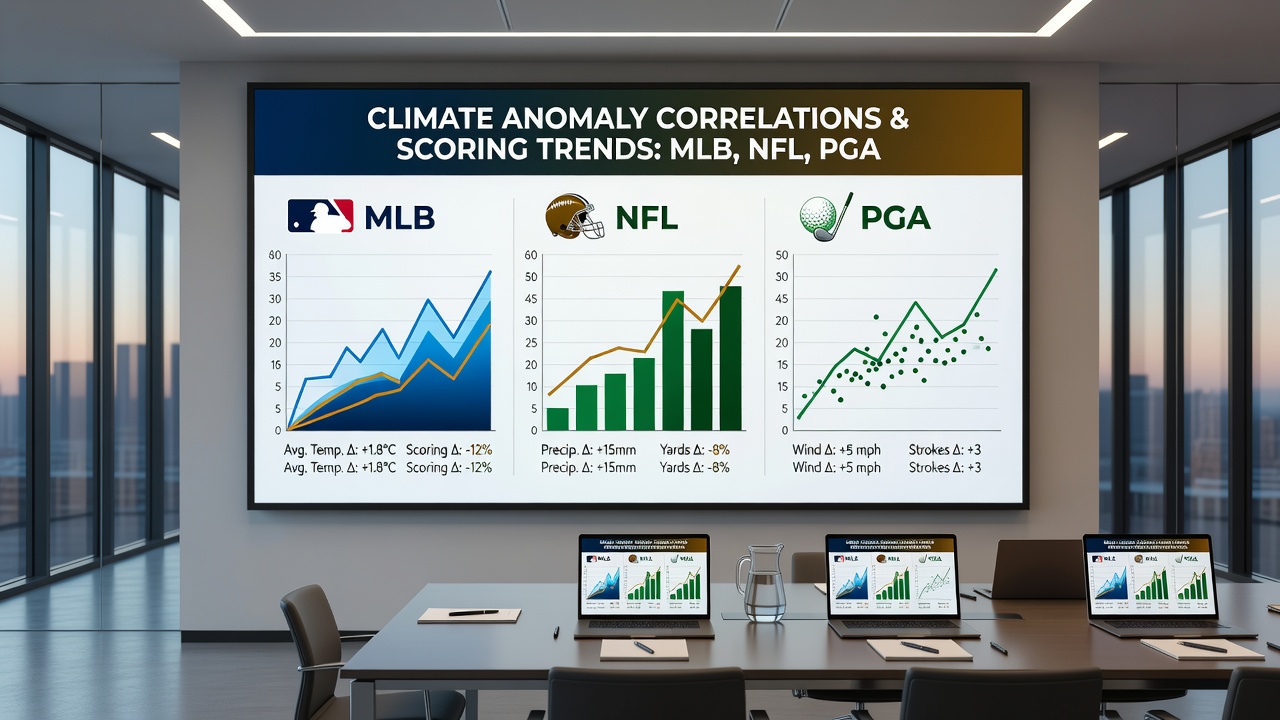
Golf provides a granular view of climate effects because individual rounds occur under precisely logged weather conditions and courses remain fixed across multiple years. Tournament data reveal that scoring averages drop when maximum daily temperatures rise above historical norms for a given venue, primarily because firmer greens and reduced rough length allow longer drives and closer approach shots. In July 2026, several events held during a pronounced heat wave recorded scoring averages nearly one stroke lower than the same events in the preceding five-year period.
Wind anomalies produce the opposite result. When sustained breezes exceed typical levels, scoring climbs as players face narrower landing areas and more unpredictable ball flight. European and Australian meteorological agencies have supplied comparable datasets for international tournaments, confirming that the same temperature and wind relationships appear across different grass types and course architectures. Statistical models that incorporate dew-point readings further refine these correlations, showing that higher humidity can offset some distance gains from heat by increasing air density.
Cross-League Comparisons and Data Sources
Comparative examinations across the three circuits highlight both shared and distinct mechanisms. MLB and PGA events display stronger positive correlations with temperature increases, whereas NFL scoring responds more noticeably to cold-weather and wind anomalies. Researchers note that these differences align with the physical demands of each sport and the typical seasonal windows in which games occur. Longitudinal datasets extending into 2026 continue to support the observed patterns, although year-to-year variability remains high due to roster changes and rule adjustments.
Additional context comes from reports issued by the Australian Bureau of Meteorology and academic papers archived through university repositories in the United Kingdom, both of which supply independent verification of temperature and wind effects on outdoor athletic performance. These sources complement domestic records and allow analysts to test whether the relationships identified in North American leagues generalize to other climates.
Conclusion
Available evidence establishes that climate anomalies correspond with measurable shifts in scoring metrics across MLB, NFL, and PGA circuits, with temperature and wind serving as primary variables. Continued collection of granular weather and performance data will permit refinement of these statistical relationships in subsequent seasons.