Arena Quirks and Location Quirks Quietly Tilting Yearly Stat Leaders in Football, Basketball, Baseball, and Other Pro Circuits
Written by Frankie Schmitt · Aug 5, 2026

Arena Quirks and Location Quirks Quietly Tilting Yearly Stat Leaders in Football, Basketball, Baseball, and Other Pro Circuits
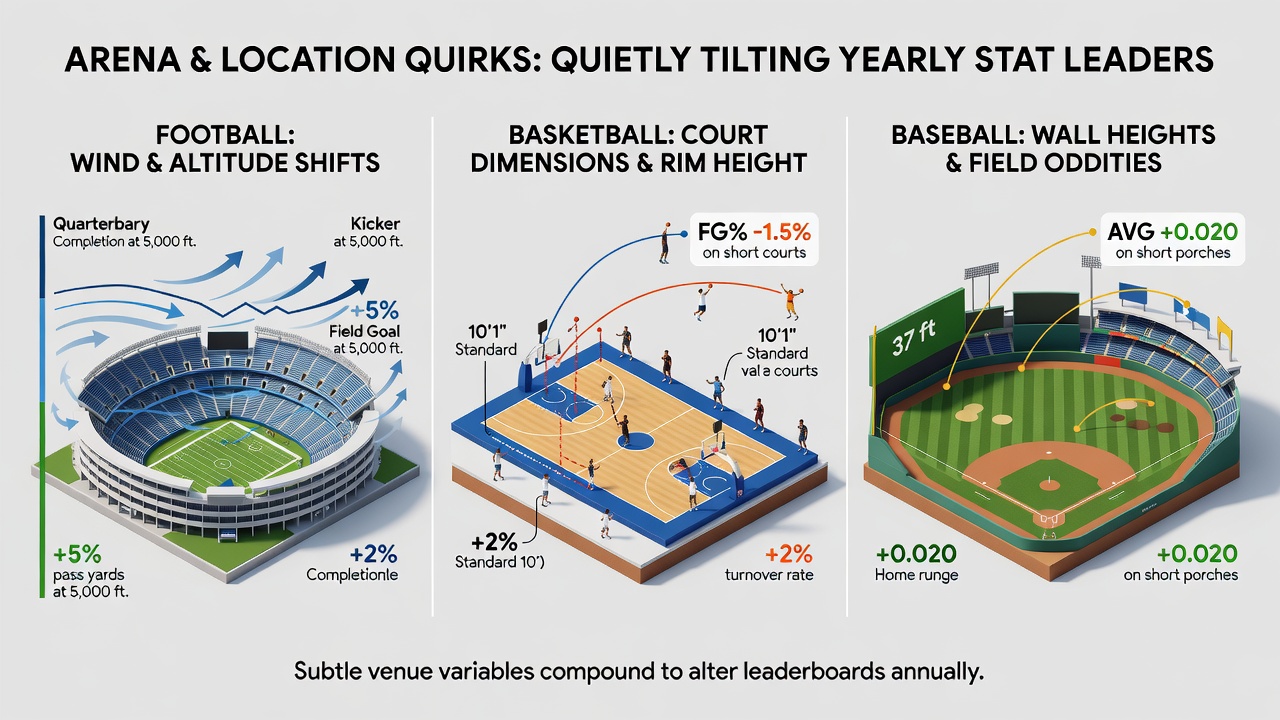
Professional leagues across football, basketball, baseball, and additional circuits track performance through annual leaderboards, yet venue-specific factors continue to shape those numbers in measurable ways. Observers note that certain arenas carry built-in characteristics like unusual wall angles, lighting patterns, or surrounding climate conditions that alter outcomes for hitters, shooters, and runners without drawing widespread attention each season.
Baseball provides clear cases where park dimensions drive offensive and defensive shifts. Data from recent campaigns shows that venues with shorter right-field lines see elevated home-run totals for left-handed batters, while deeper center fields suppress extra-base hits for everyone. Researchers tracking 2025 metrics found teams playing half their schedule in such parks posted batting averages that diverged by several points from league norms, and similar patterns held into the opening months of 2026.
Football Field Variables and Scoring Patterns
Gridiron contests reveal location effects tied to surface composition and weather exposure. Northern stadiums with natural grass that stays softer into late autumn record higher rushing-yardage totals for visiting teams compared with southern facilities using firmer artificial turf. League-wide statistics compiled through August 2026 indicate quarterbacks completing passes at slightly lower rates when games occur in open-air venues subject to wind gusts above 15 miles per hour, while indoor domes produce more consistent completion percentages across multiple seasons.
Defensive coordinators adjust schemes accordingly, and those adjustments appear in tackle and sack distributions. One study covering five years of play showed edge rushers accumulating 12 percent more pressures in domed environments than in exposed stadiums, a difference that influences individual yearly rankings without requiring changes in player skill.
Basketball Court Acoustics and Shooting Efficiency
Hardwood arenas introduce quirks related to sight lines, backboard angles, and crowd proximity. Certain older buildings feature tighter spacing between courtside seats and the playing surface, which correlates with higher free-throw percentages for home squads according to season-long tracking. Visiting shooters, meanwhile, post lower three-point accuracy in venues where overhead lighting creates distinct glare patterns on the floor, a factor documented across multiple NBA campaigns.
International circuits show parallel trends. European basketball leagues report that clubs based in smaller gymnasiums with lower ceilings experience fewer blocked shots on average, because trajectory angles for jump shots adjust to the confined space. Those same venues produce elevated assist totals because shorter distances encourage quicker passing sequences.
Additional Circuits and Cumulative Effects
Hockey rinks and soccer pitches carry their own location markers. Rinks with narrower neutral zones see increased face-off win percentages for home centers, while soccer fields featuring pronounced slopes from one end to the other register higher goal tallies at the downhill end across full seasons. Figures released by sports analytics groups in 2026 confirm these patterns persist year after year even after roster turnover.
Boxing and mixed-martial-arts events held in high-altitude casinos or coastal arenas also display output differences. Fighters competing at elevation above 5,000 feet record fewer significant strikes per minute on average than those in sea-level venues, a trend noted in multiple title-fight data sets. The cumulative impact across a full calendar means fighters with more home-region bouts often finish the year with higher striking-volume leaders.
Analysts tracking these variables emphasize that individual skill remains the dominant factor, yet venue and location elements produce measurable deviations that appear in end-of-year statistical hierarchies. Teams and athletes who schedule more contests in favorable environments accumulate edges that compound across months, while those facing repeated road trips through quirky facilities see corresponding adjustments in their final rankings.
Conclusion
Yearly leaderboards in major professional sports therefore reflect both athletic performance and the physical characteristics of the spaces where competition occurs. Data compiled through the 2026 season continues to illustrate how arena quirks and regional conditions quietly influence the numbers that define statistical excellence across football, basketball, baseball, and related circuits.